Elmer Thomas Park Map
This is a basic park map made for visitors of Elmer Thomas Park in Lawton, Oklahoma.
A UW Tacoma alum with a passion for all things spatial
The one you need on your team.
Over the last several years I've been fortunate to have several diverse roles in the field of GIS. From GIS intern to Application Developer, I've done it all! This broad range of experiences has not only given me a diverse skillset but also a welcoming attitude toward new adventures. I'm a big believer that being a positive and contributing member of a team is extremely important and try to manifest this in every-day life. Overall, my intrinsic motivation to learn and solve problems makes me an invaluable asset to any team looking to attack issues with spatial solutions.
Some of my previous web based develoment projects.
PublicGIS was the first large custom application I helped develop using Expereince Builder Developer Edition. During my first year as a GIS Programmer for Pierce County, Washington I contributed greatly to the application's overall UI/UX design and custom widget development.
The Park Finder app was built using the ArcGIS Instant Apps, specifically the Nearby template. This project involved multi-department collaboration and custom popups configured using ArcGIS Arcade espressions.
This was the first Experience Builder application that I created during my time as a GIS Analyst for the City of Lawton, Oklahoma. This application won Best Web Experience at Oklahoma South Central Arc Users Group Conference in 2022. The accompanying poster won Best Poster the same year.
The following web based applications were created during my time in the UW Tacoma MSc program.
Some of my previous cartography work.
Click the image to view, print, or download a .pdf version.
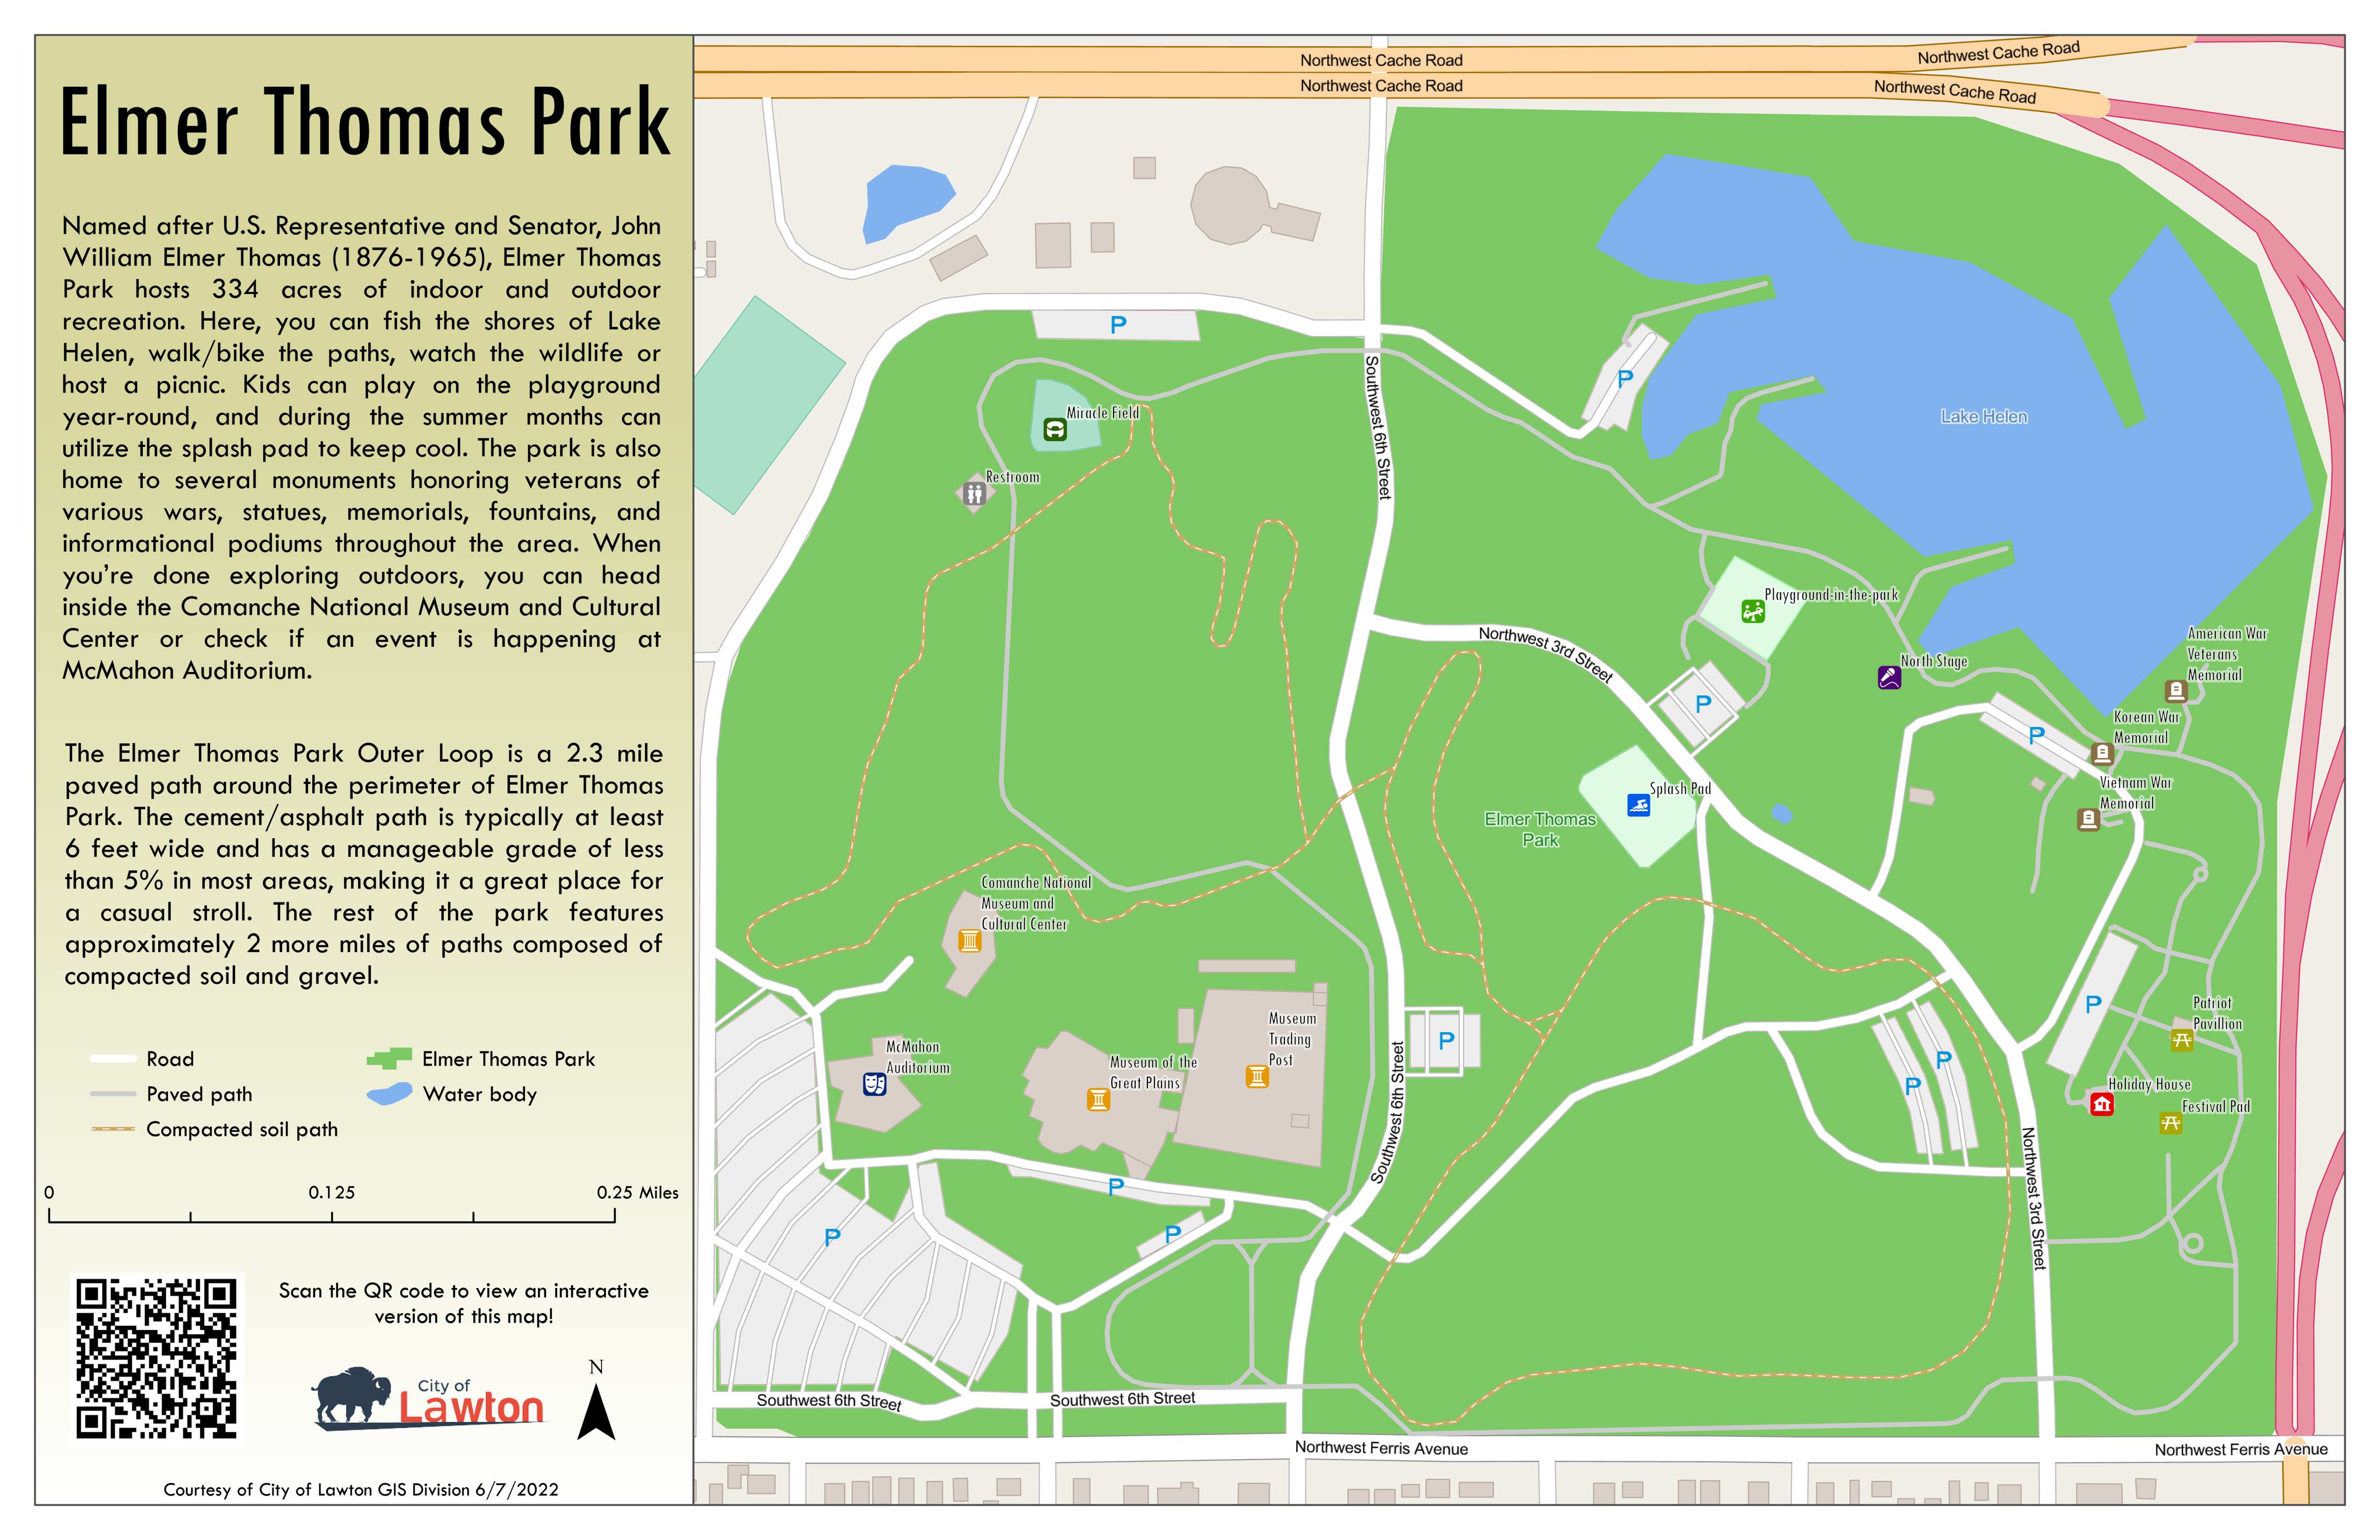
Elmer Thomas Park Map
This is a basic park map made for visitors of Elmer Thomas Park in Lawton, Oklahoma.
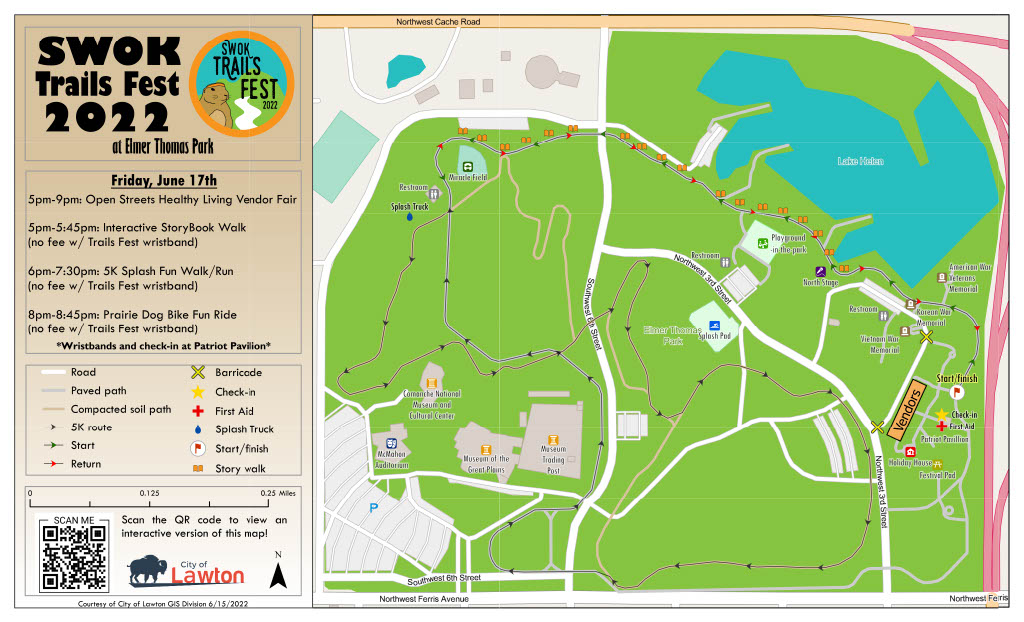
Trails Fest
This park map was made in preparation for South Western Oklahoma (SWOK) Trails Fest 2022.
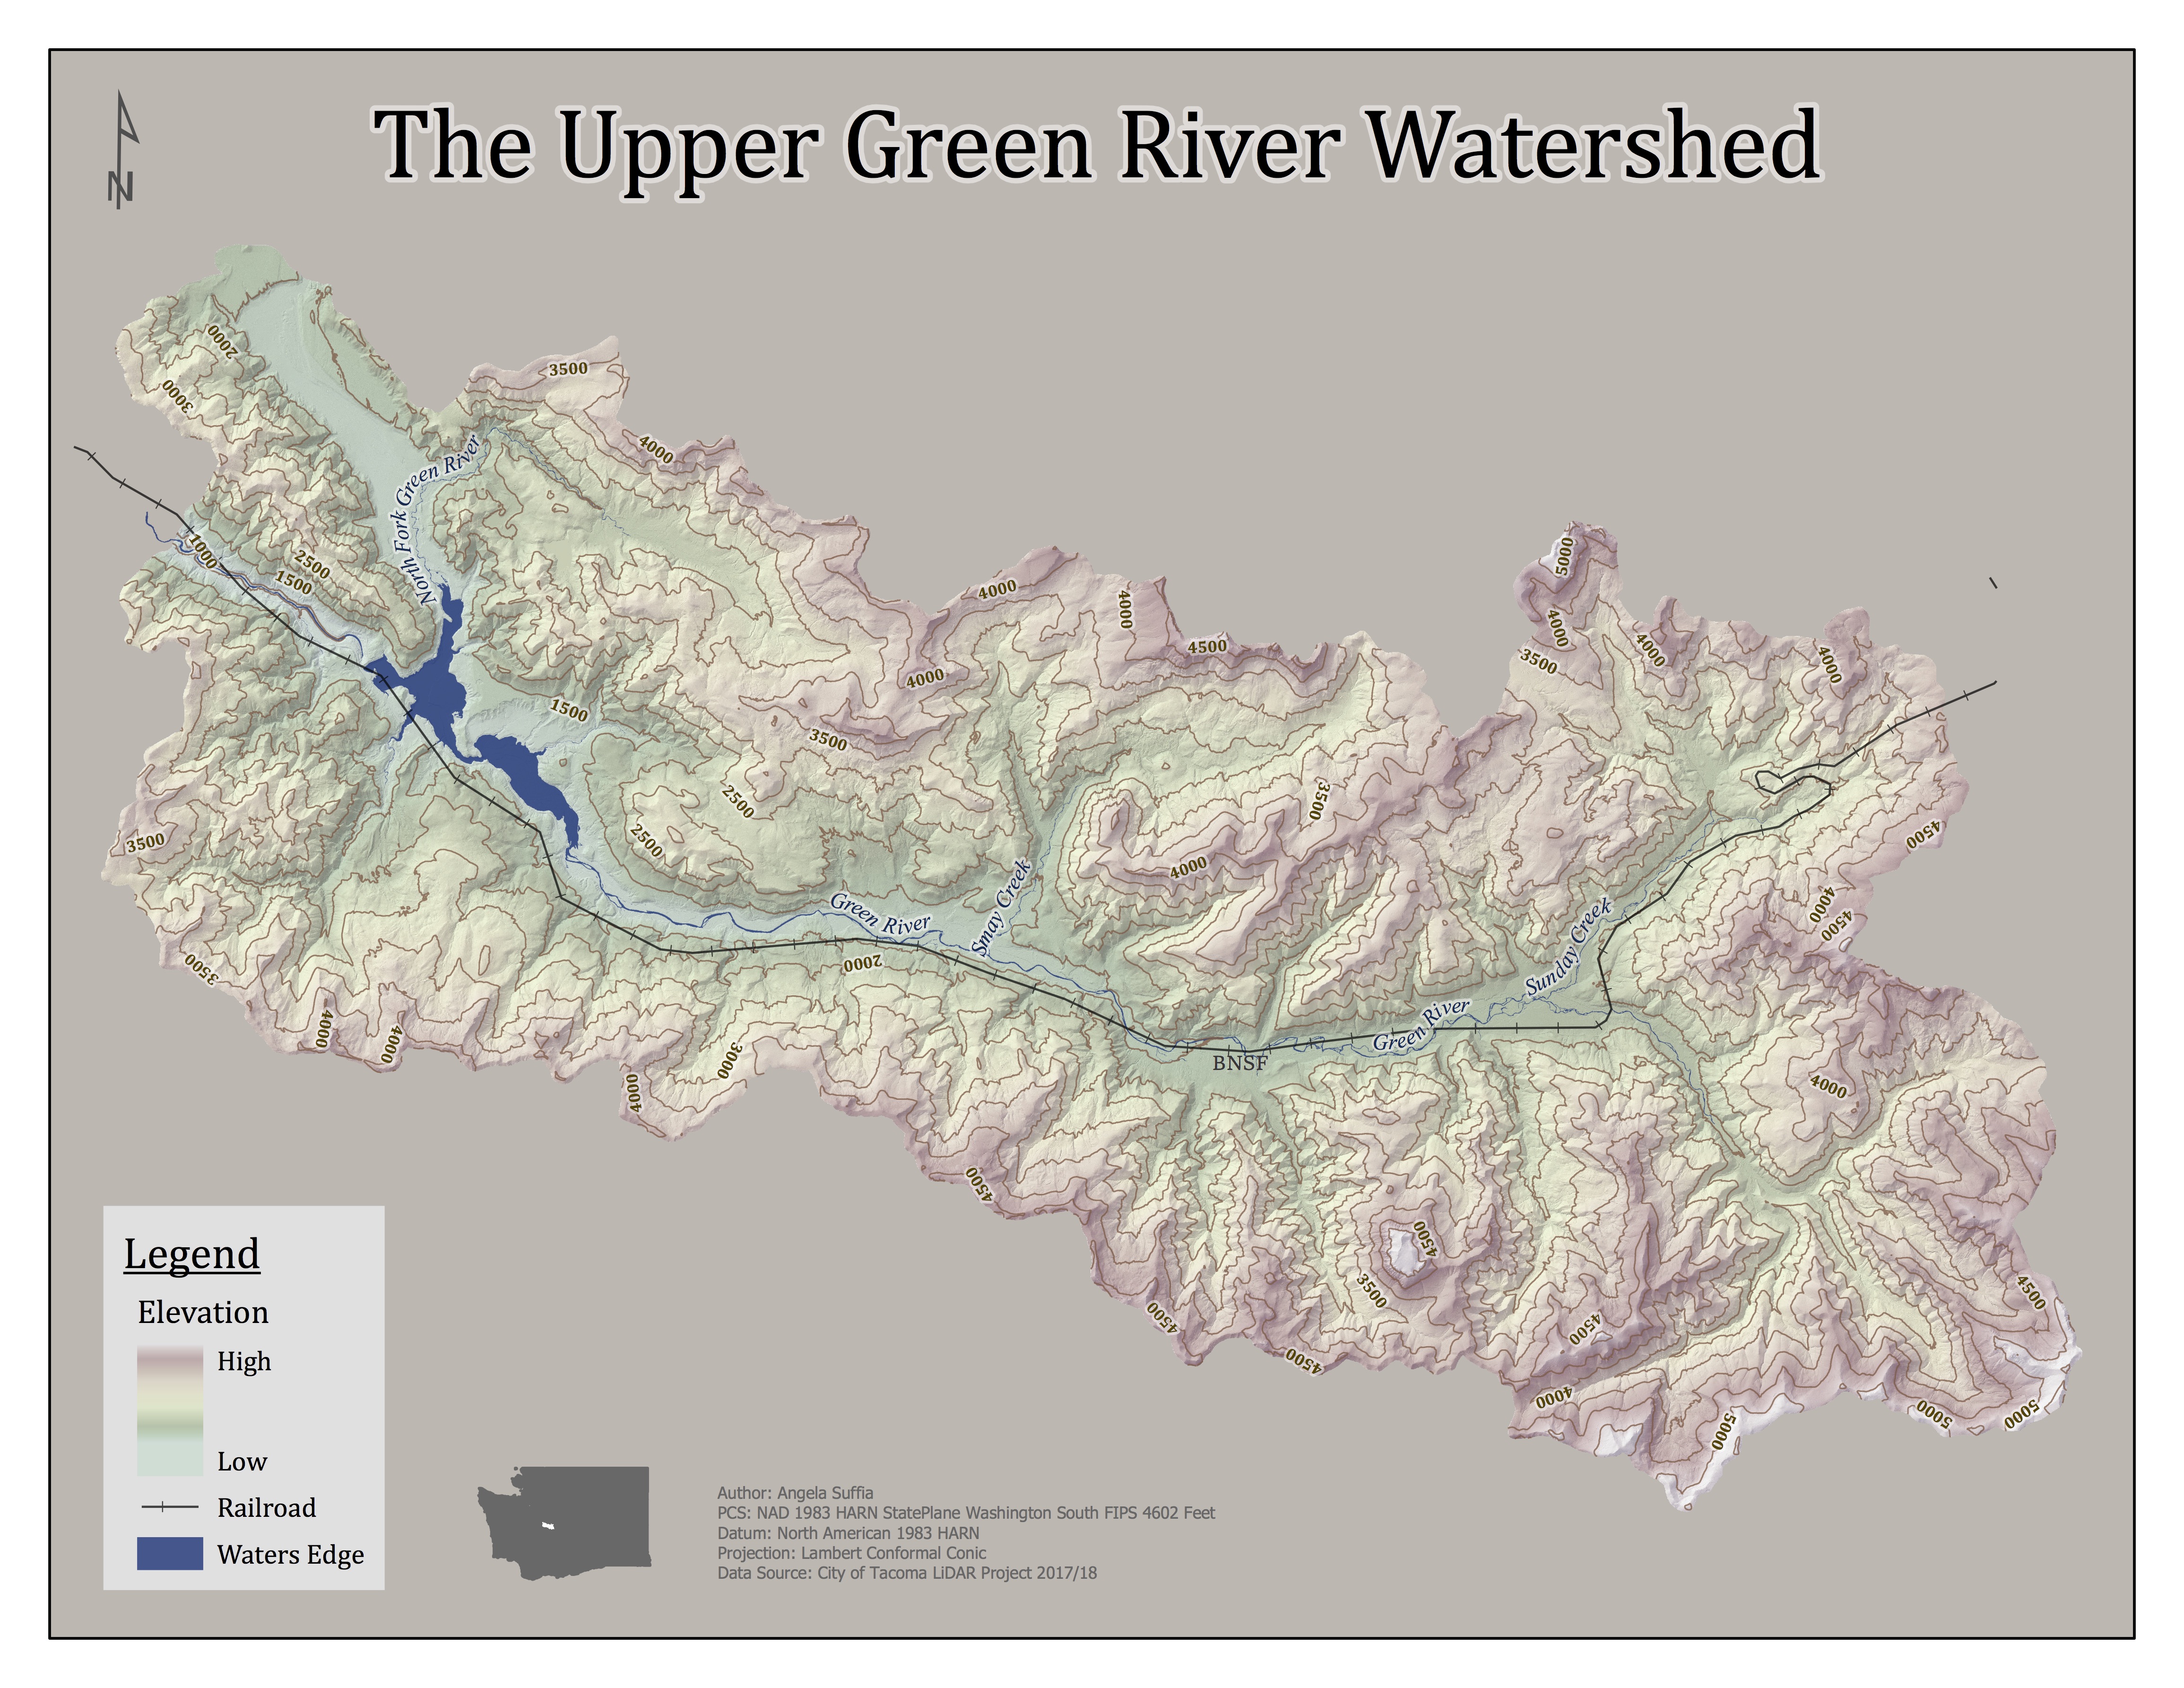
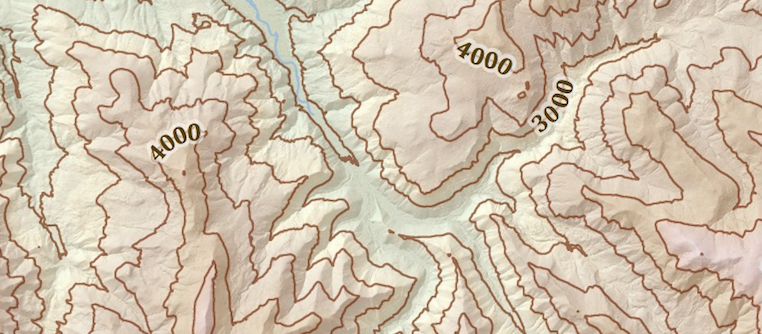
Terrain of the Upper Green River Watershed
For this visual I made a custom hillshade from a LiDAR derived DEM. Then I symbolized the DEM by elevation value and draped it over the hillshade layer with a slight transparency. Finally, 500 meter contours as well as water body and rail roads were added for reference.
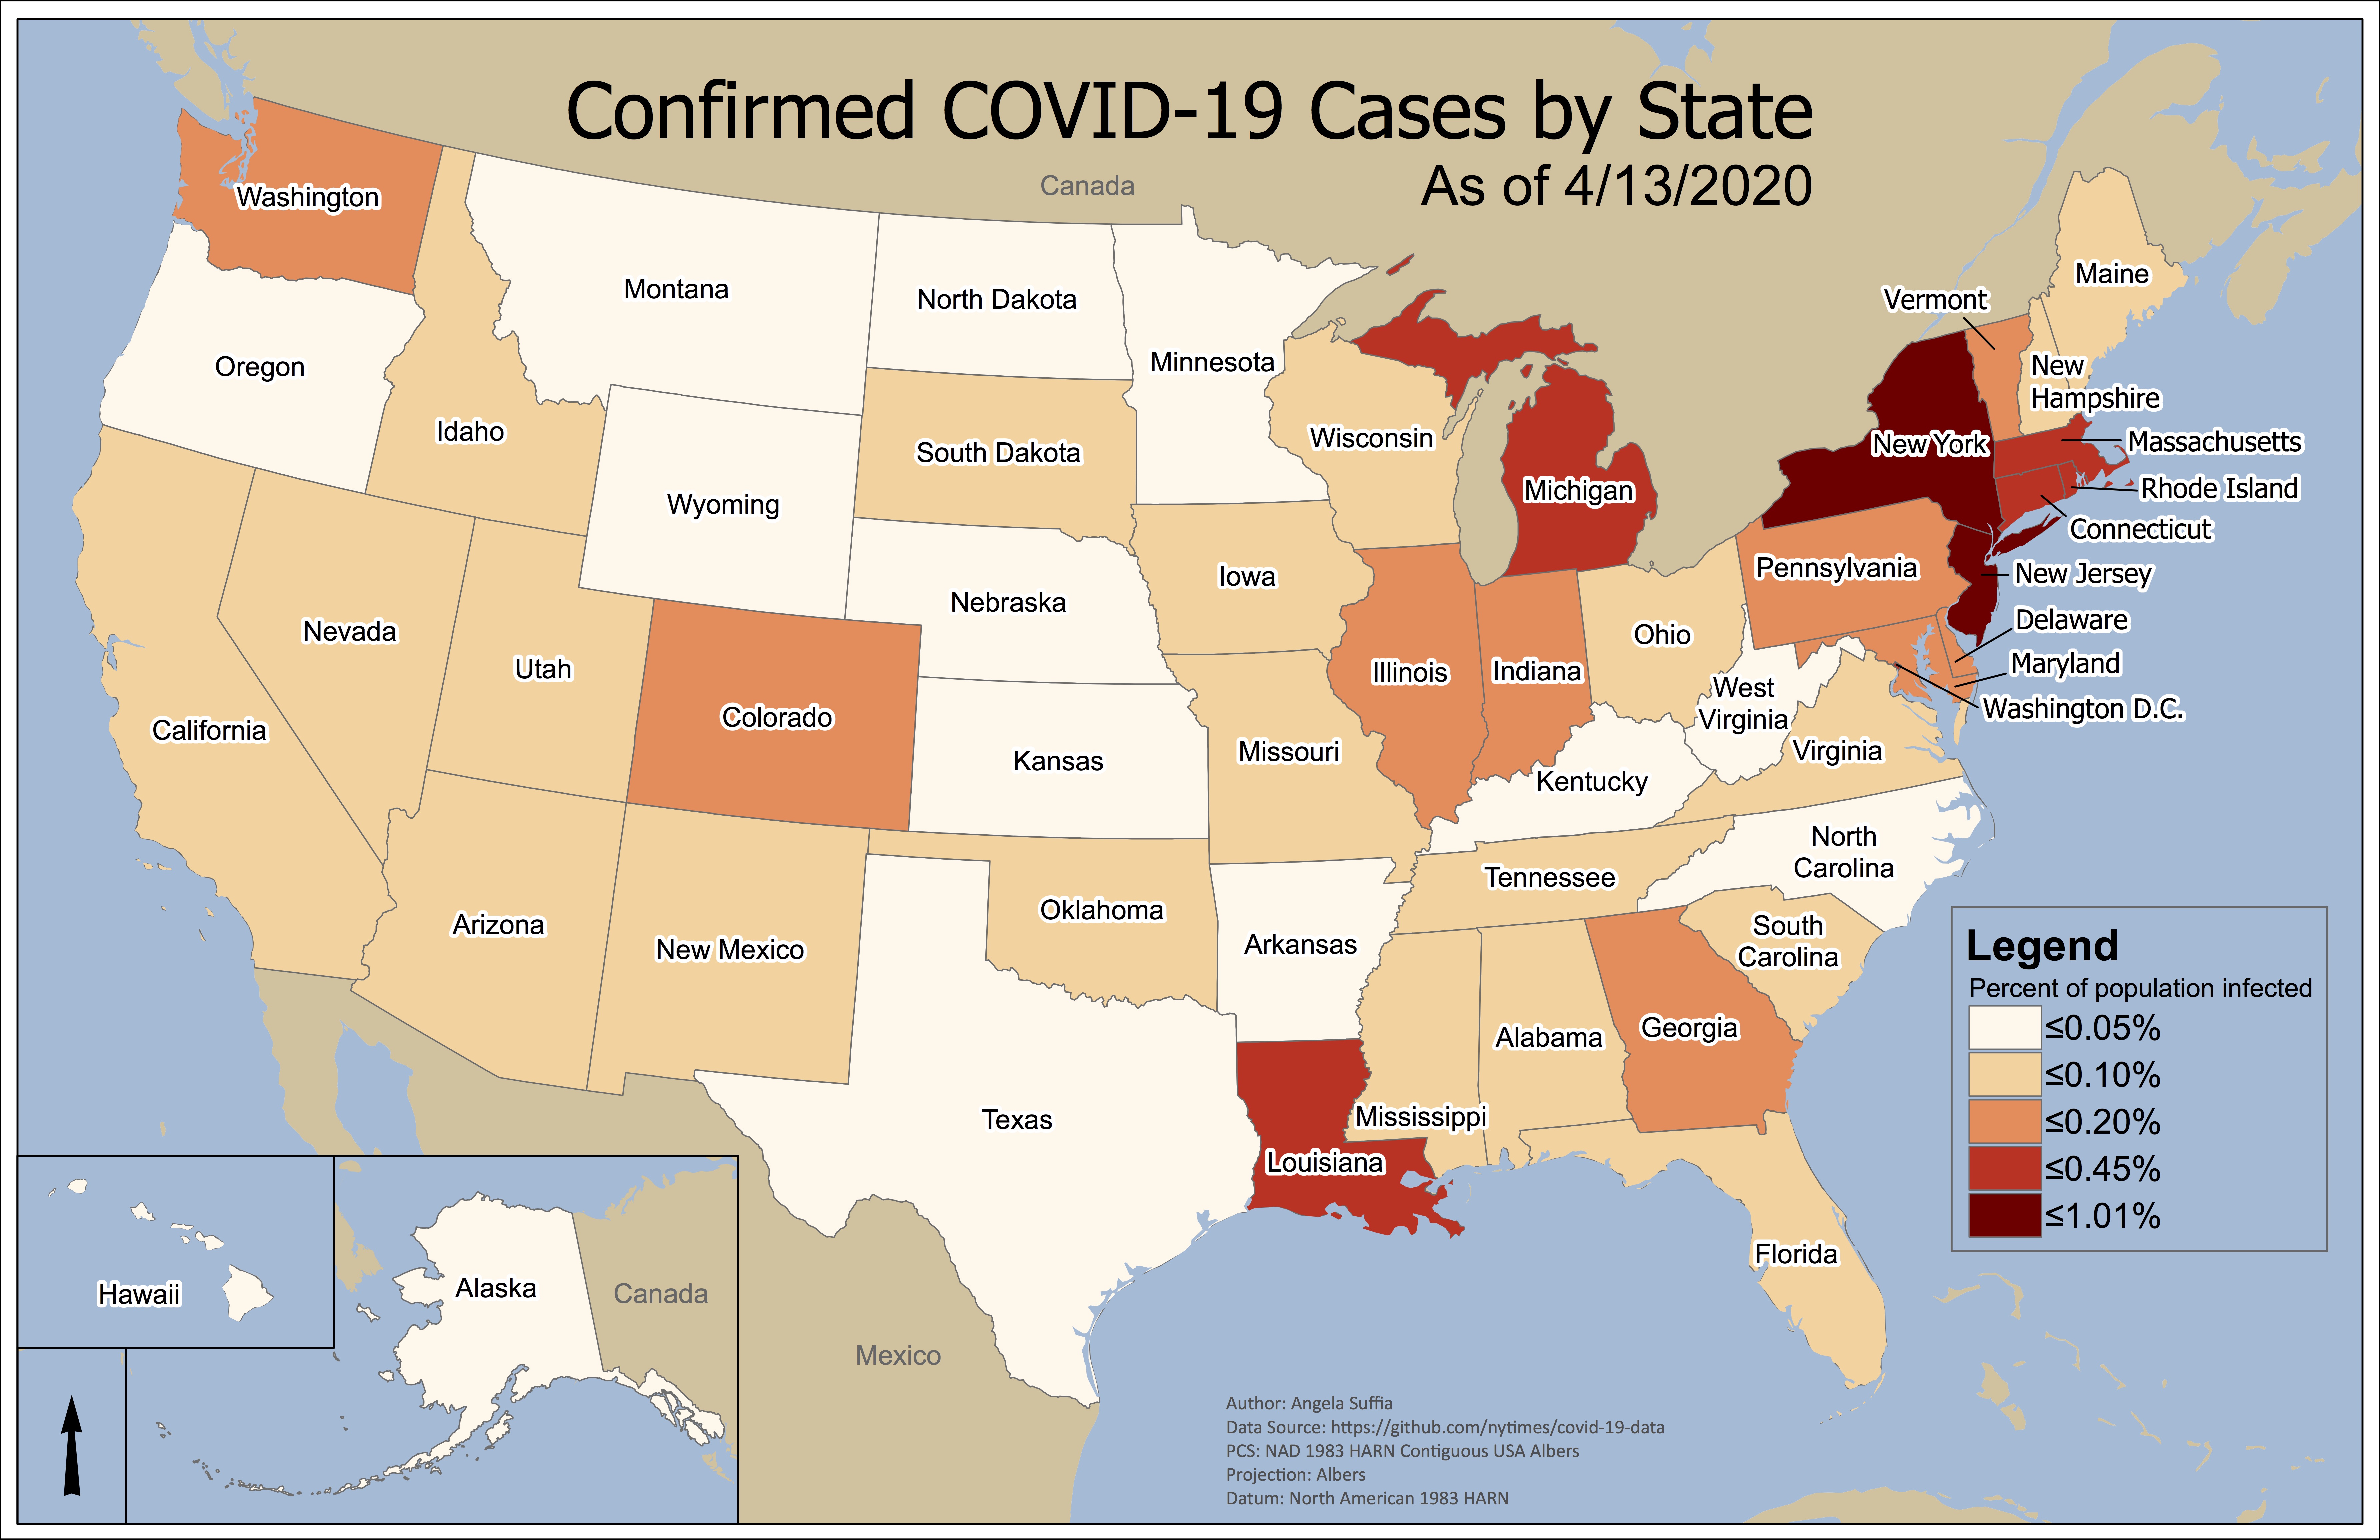
COVID-19 Cases in the United States
This choropleth map diplays confirmed COVID-19 cases as of 4/13/2020 normalized by state population. Data was classified using natural breaks and symbolized with graduated colors to show states with greater proportions of cases.
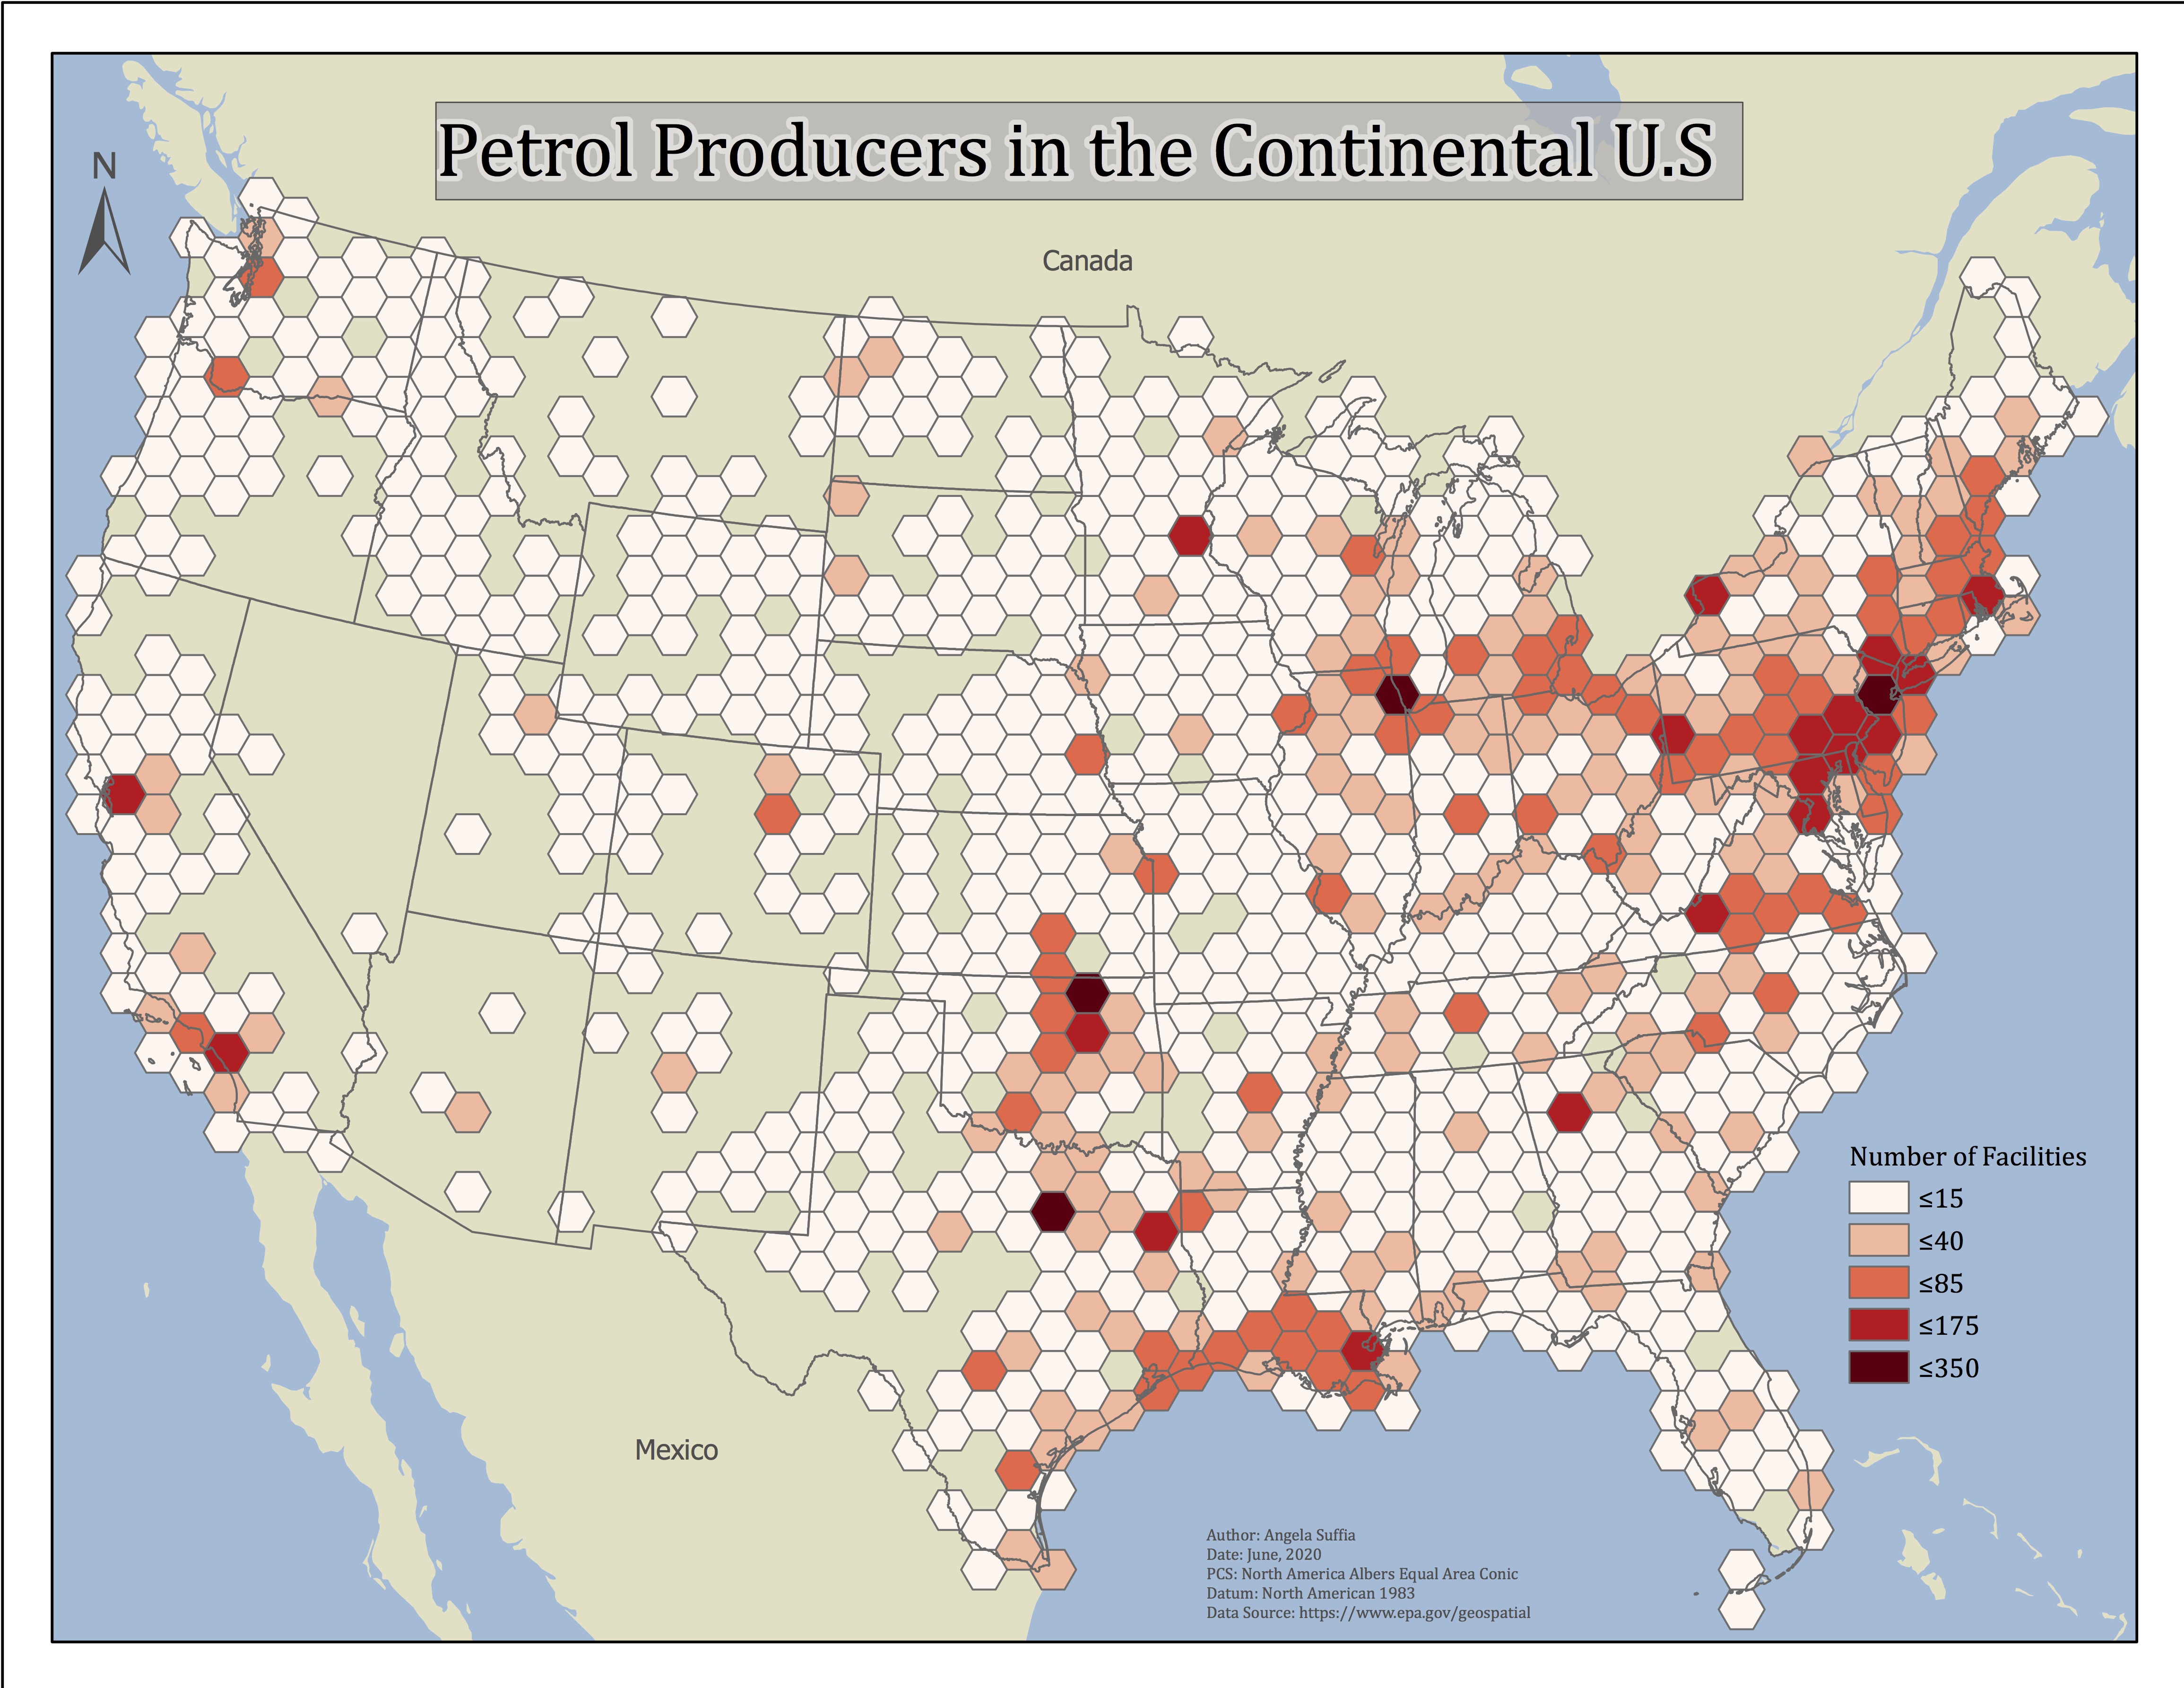
Hexbin Mapping of Petrol Facilities
Each Hexbin tile was created to be 2500 square miles using ArcPro's Generate Tesselation Tool and the point data for petrol facilities was joined to the hexbin layer. Hexagons were symbolized using graduated colors to indicate areas with more facilities than others.
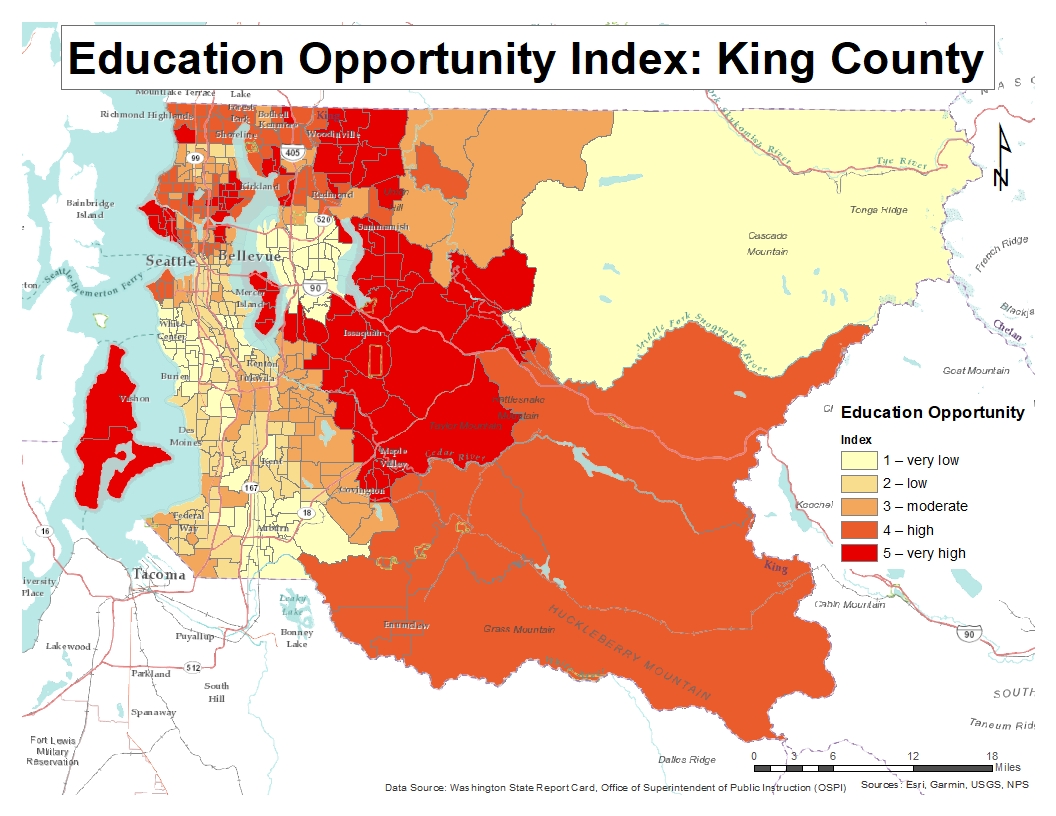
King County Education Opportunity Index
This educational opportunity index for King County, Wasington was created using the 'z-score' method. Indicators for opportunity used in this index include, reading test scores, math test scores, student poverty, teacher qualifications, and graduation rates.
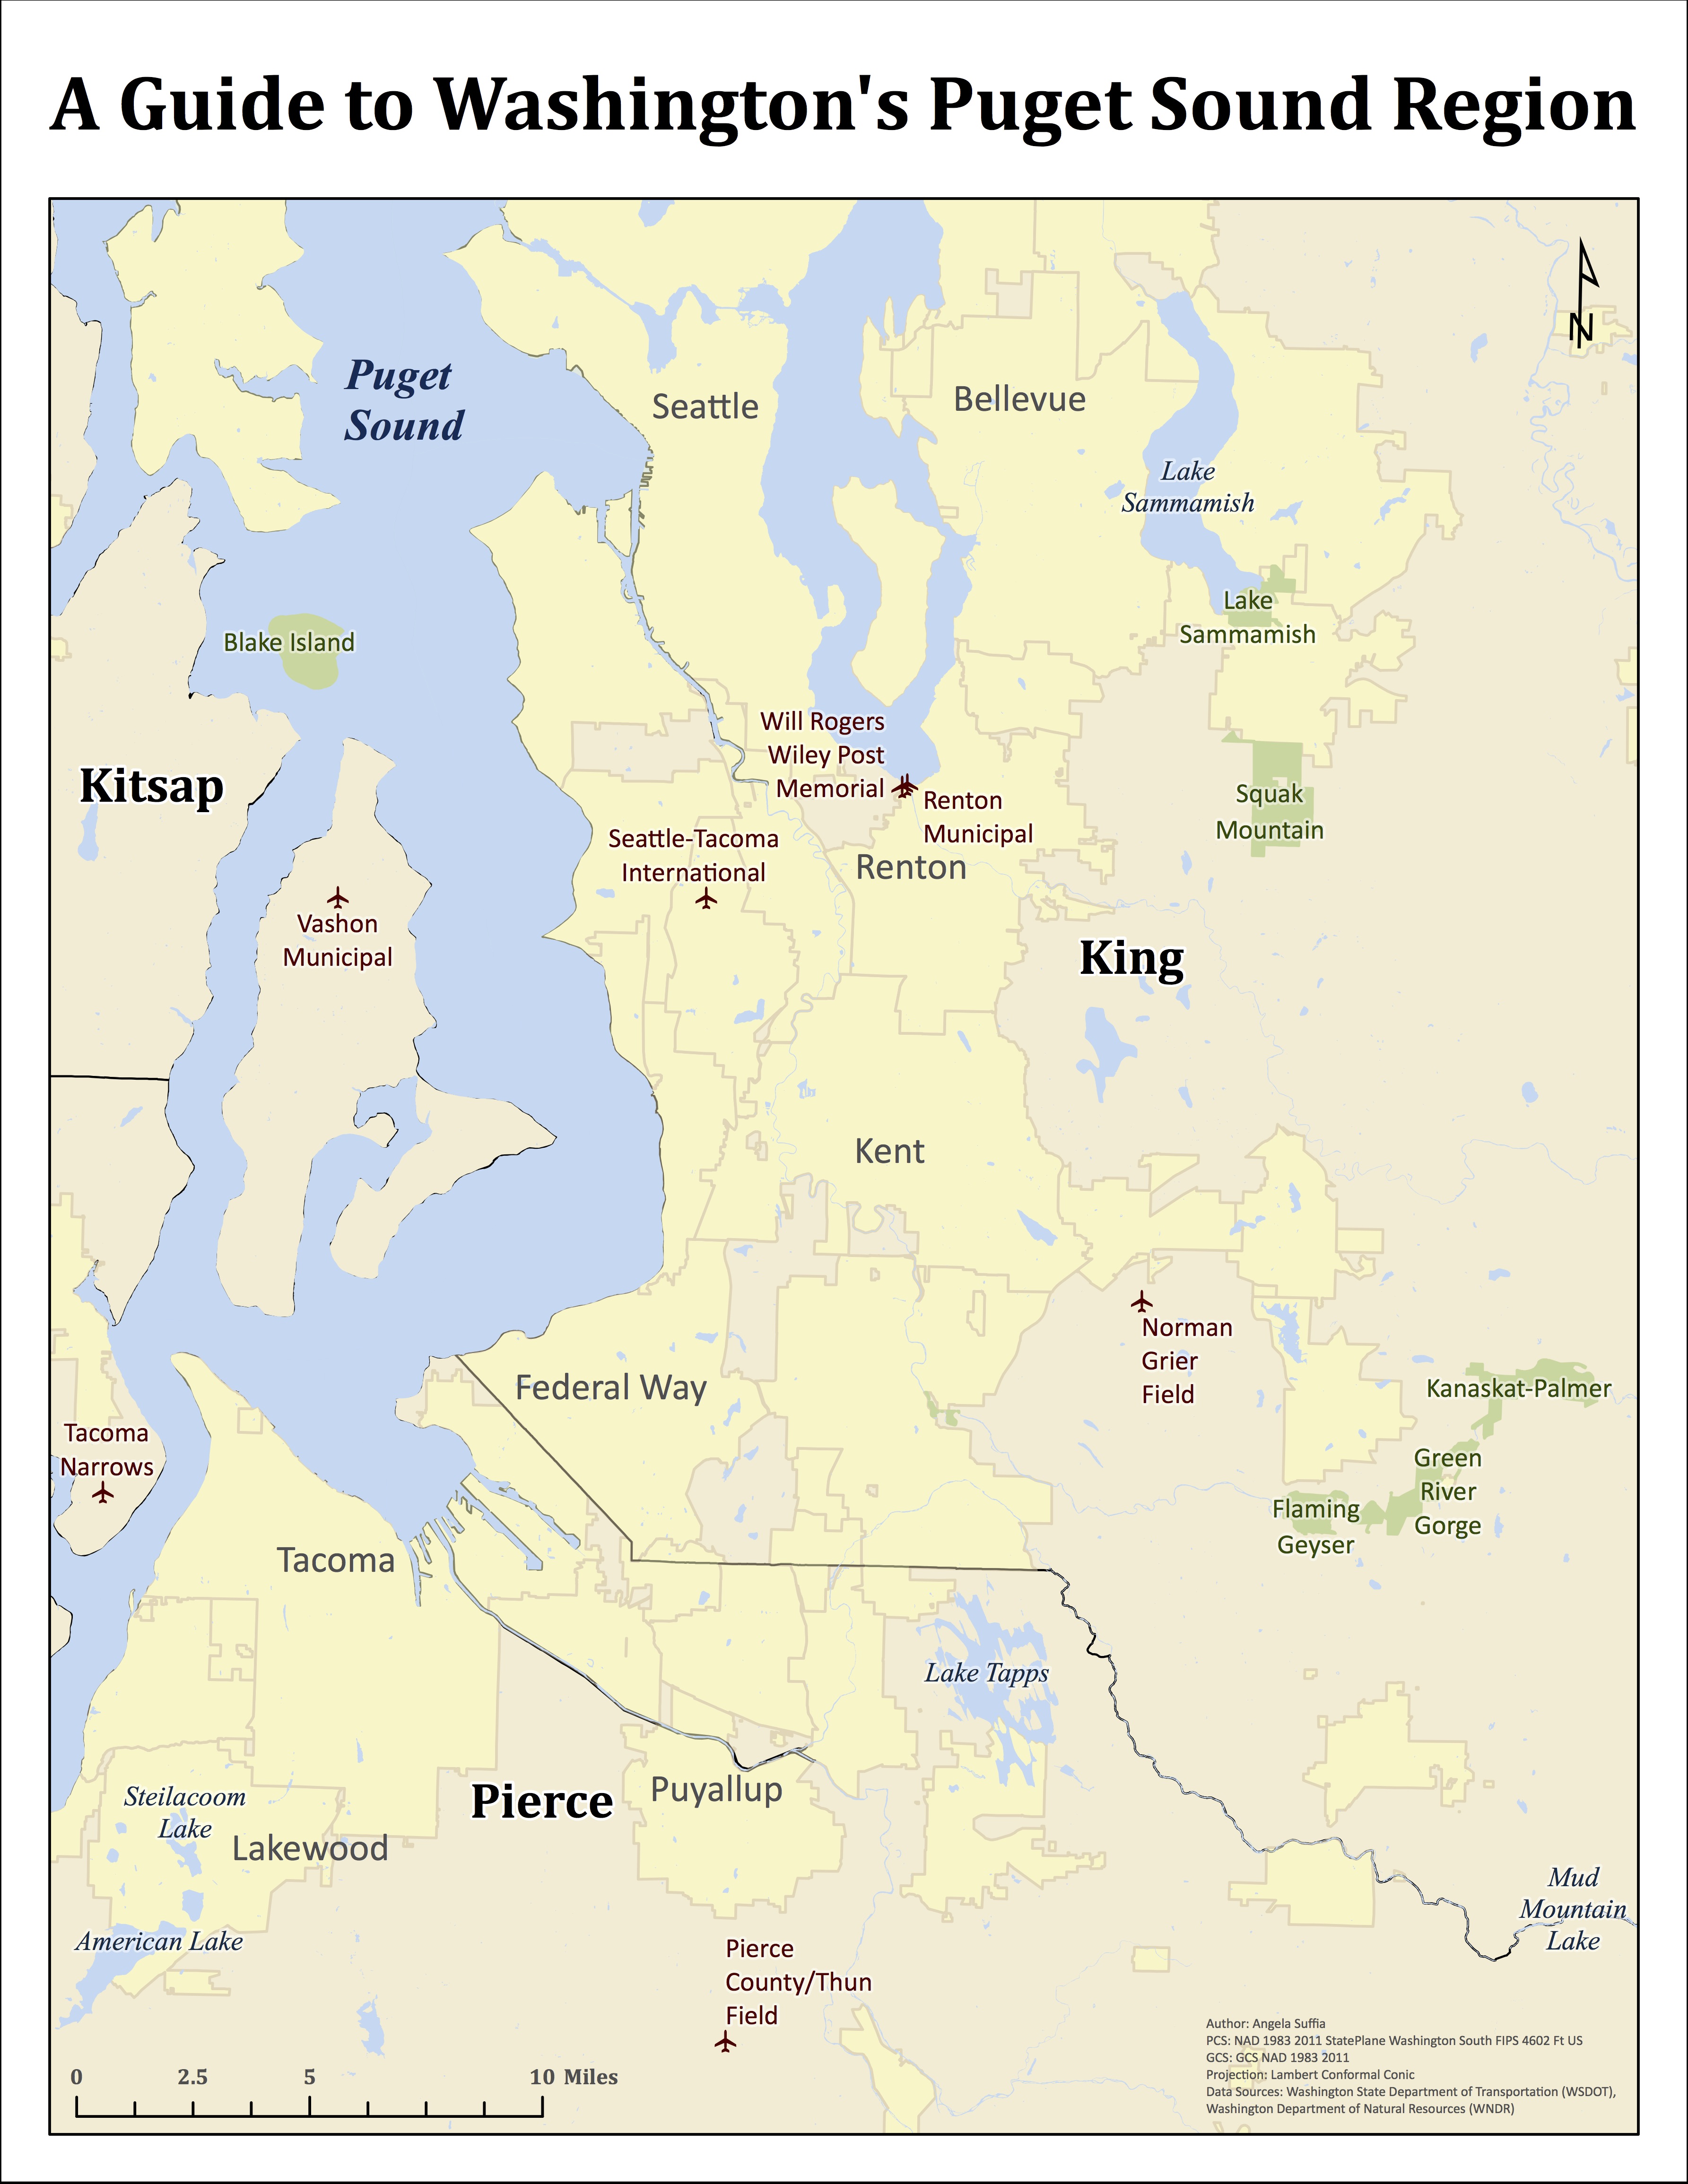
Points of Interest, Puget Sound
Layers were carefully labeled using varying text colors, sizes, and fonts to create visual hierachy for easy reading.